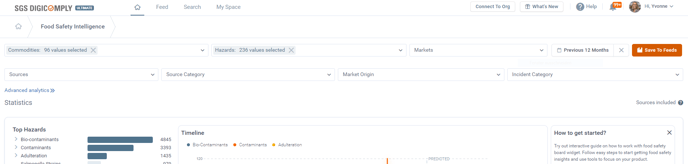
To effectively monitor and manage food safety risks for your product groups, use Food Safety Intelligence. It simplifies staying updated on critical external risks, ensuring a comprehensive understanding and proactive approach to food safety.
FSI offers reliable data with predictions from trusted sources (governmental bodies, NGOs), free of duplicates and news articles. For comprehensive data, including duplicates and news coverage, without predictions, explore Incident Search.
Begin by selecting the filters of your interest:
- Commodity - The commodity categories are based on the Codex Alimentarius Food Category System, with some modifications and adjustments to the groups. Here product or product group is given, starting at the broader product group level with "Dairy Products and Analogues," we can delve deeper into specific subgroups like "Cheese and Analogues" and "Ice Cream."
- Hazard - Potential source of harm, starting at the broader group level with "Bio Contaminants," we can focus on subgroups such as "Mycotoxins," and further narrow down to specific substances like "Aflatoxin B1."
- Incident Reporting Market - Market, where the incident was reported.
- Source - Source identifies the website, where the content was collected from.
- Source Classification - Type of the source.
- Market Origin - Market, where the incident happened.
- Incident Category - Control, Recall, Fraud, Outbreak, Consumer Complaint.
- Date filter - Automatically set for the past 12 months, starting from the day the FSI is accessed. When deselecting all dates (by clicking the "X"), you will see all available incident data. Please note that different sources have data available from different years, depending on when they began collecting or storing it.
Upon querying in filter fields, you receive insightful statistics: The top hazards and top commodities are displayed in charts, along with the maps showing the countries where the incident was reported and the market of origin within the incident category statistics.
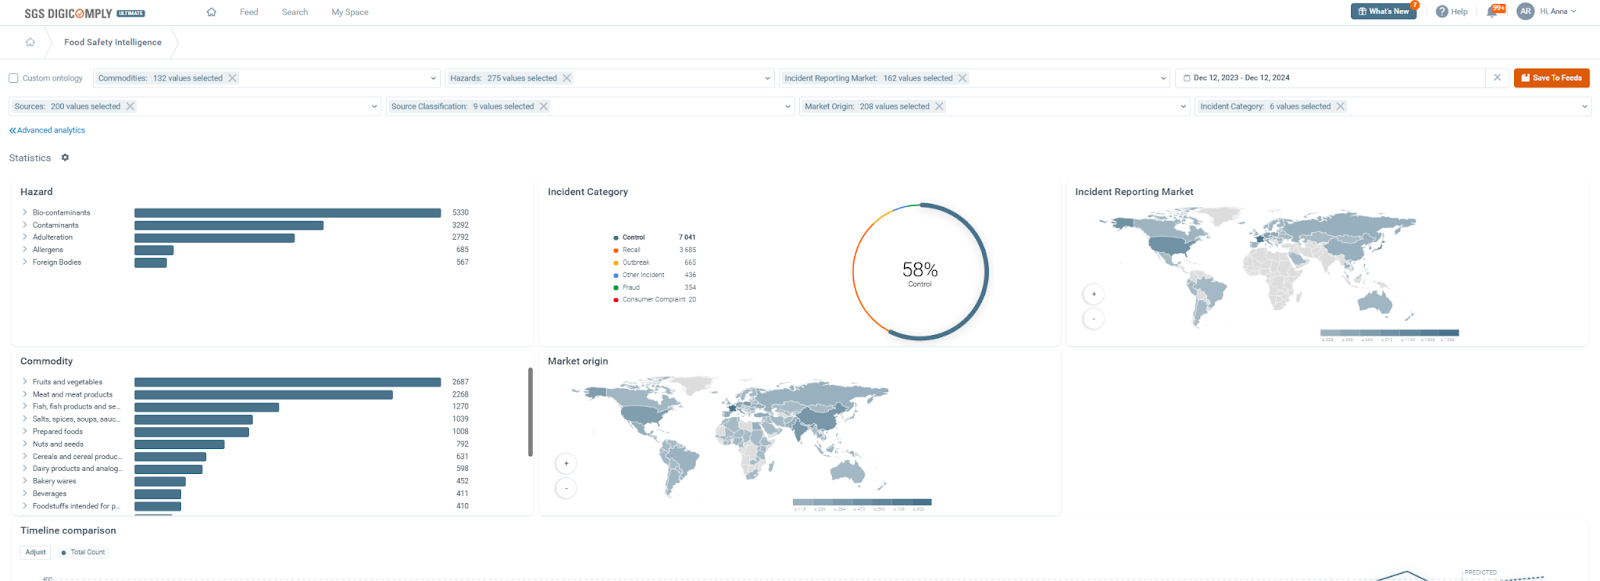
The widget can be customized by clicking 'Customize widgets' to fit specific needs.

Interacting with the Charts
Click directly on any specific Hazard, Commodity, Incident Category, or Country on the map.
When you make a selection on a chart, the rest of the dashboard - including the Incident Database below - updates automatically to reflect your selection.
(In the example below, we have selected "Adulteration" as the hazard, "Fruits and Vegetables" as the commodity, and "China" as the origin).

Note:
Top Filters: Adjusting the dropdown menus at the very top of the page updates everything (charts, database, and timeline).
Chart Clicks: Clicking inside the charts updates the view of other charts and the database, but it does not change the text in the top filter fields.
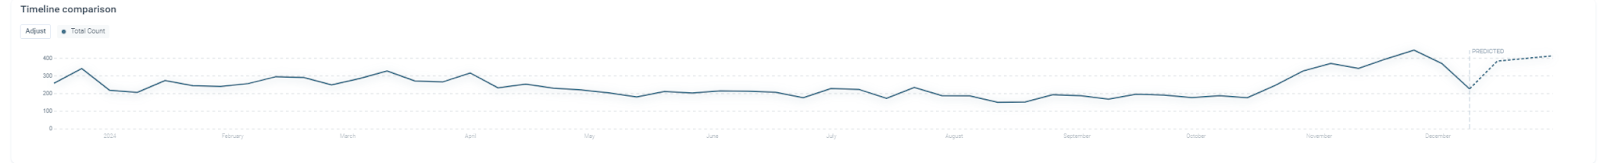
Timeline Analysis & Predictions
The timeline provides a temporal view of the data, showing trends over the last 12 months.
-
Comparisons: By default, the total count is displayed. However, you can compare up to 5 different dimensions within one category (e.g., compare Aflatoxin B1 vs. Ochratoxin A).

-
Predictive Analytics: The timeline includes a predictive analysis for the upcoming 2 weeks, offering valuable foresight for risk mitigation.
-
Range Selection: You can zoom in on a specific period by clicking and dragging to select a date range directly on the timeline.

The Incident Database
Located at the bottom of the page, the Incident Database lists every individual report that matches your current filters.
- It displays the specific commodity, hazard, reporting market, and origin.
- Each entry contains a direct link to the original source, allowing you to verify the data and conduct further investigation.

- You can download the current list of incidents for offline analysis by clicking the EXPORT button on the right-hand side (generates a CSV file).

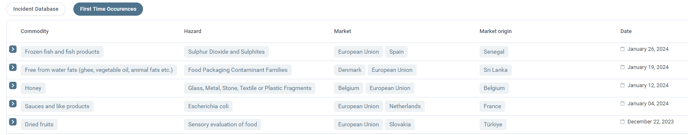
Early Warning: First-Time Occurrences
To spot emerging risks, switch to the "First Time Occurrences" tab above the database.
- This view highlights new combinations of commodities and hazards that have never been reported before.
- Identifying these new pairings allows you to proactively assess potential risks before they escalate into widespread issues, ensuring the safety of your product portfolio.
Sharing & Collaboration
The FSI platform uses Dynamic URLs. This means the web address in your browser updates as you change parameters.
-
Simply copy and paste the URL to a colleague. When they open the link, they will see the exact same filtered view, charts, and data that you are looking at.
Tip: You can also save these views permanently. Click here for the tutorial on saving feeds with your queries from FSI.